Blog of an overweight SharePoint addict

Thu 1 Oct 09

Creating a Sales Dashboard using the DataViewWebpart & XSL

Filed under: SharePoint, Training, XML — Reginald @ 7:51 pm

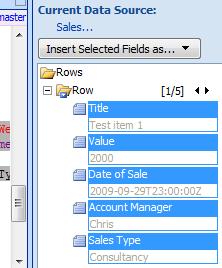
So not too long ago, a client of mine decided that they wanted some nice charts on their WSS based intranet. You see the problem straight away.. No Moss, so no access to the KPI webparts, so it was time to drop to the old faithful, the Data View Web part to solve this problem…


Scenario:- The Sales Director wants to have a screen in SharePoint where he can monitor all Sales Managers performance against target for the current month.

Use case:-
• Data should be displayed as a single bar for each sales manager.
• Data should also be broken down against the targets for Consultancy and Managed services.
• Sales Data will be entered as Sales order numbers are generated on receipt of a firm order.
• Sales target will be 1/12 of the yearly target. No adjustment will be made for time of year.
• Bar colour should change depending on % of target achieved. <50,50-99,100 will be the bands used.

First we create a custom list called Sales that will be used to track every sale, this is created with the following fields.

Title ———– String – Sale comment
Value ———– Currency – Value of the sale
Account Manager – Lookup – A lookup to the list of Sales Managers
Sales Type —— Lookup – A lookup to the list of Sales Types
Client ———- BDC Lookup to SalesForce (Use a string for now as it makes no difference to this example)
Date of Sale —- DateTime (Date only)
StartofMonth —- Calculated (DateTime-Date only) – This field is calculated using the following formulae to give the first day of the month this order was dated in. (See below for an explanation of why we use a calculated column)

=DATE(YEAR([Date of Sale]),MONTH([Date of Sale]),1)

EndofMonth —— Calculated (DateTime-Date only)– This field is calculated using the following formulae to give the first day of the month this order was dated in. (See below for an explanation of why we use a calculated column)

=DATE(YEAR([Date of Sale]),MONTH([Date of Sale])+1,1)-1

Be careful with the creation of the column Date Of Sale as this will be used in a CAML query later on. I didn’t create this column and therefore the spaces get encoded in the CAML string (Date_x0020_of_x0020_Sale).

Best practice when creating columns is to create them with a concatenated name first, then edit and expand the name later. E.g. DateOfSale is created, then renamed Date Of Sale. The internal name remains DateOfSale, rather than Date_x0020_of_x0020_Sale!

The following data has been populated for testing (Note: I’m using this test in September, so adjust the date of sale to match the calendar month that you’re testing in.)

The test data for our chart.

The test data for our chart.

Once you’ve got that small amount of data, we’ll also need to upload the three colour images used by the CSS in the creation of the colour coded bars for the chart.

These small files can be taken from here using right click and save as. (Don’t worry about the size as they are actually only 1 pixel wide.)

RedBarYellowBarGreenBar

Red Yellow and Green bars for the chart.

Once you’ve downloaded these images, save them into the /12/TEMPLATES/IMAGES/ directory on your server (All WFE’s if installing this in a farm.)

The next step is to fire up SharePoint Designer and open up your website (Sandbox environment please if this is the first time!). In order to keep the look and feel nice and similar, I decided to copy the default.aspx in the root of the site, and repasted it as monthlyreports.aspx (all in SPD). Open this page in the browser and delete (not close) any webparts that are on the page. This should leave us with a nice clean page with the left nav and top chrome all visible.

Back to SPD and it’s time to add the DataViewWebPart. Click on the ‘left’ webpart zone in the design canvas to select it, then click on Insert/SharePoint Controls/DataView to place a new data view on the page.

SPD should look something like this now:-

DataViewWebPart

DataViewWebPart

Now we have the DVWP inserted, you should now see the Data Source pane on the right hand side. Look in the library for the list we created earlier. Right click on it and choose show data. this will display the list of available fields. For our Query we’re going to need the first five columns, Title, Value, Date of Sale, Account Manager and Sales Type.

Fields

Fields

Once these are highlighted, click ‘Insert selected fields as – Multiple Item View.’

Once done, you should see our test data displayed in tabular form in the design view. The only problem here is that it’s all of our data, unfiltered and unsorted. At this point, you could use a filter in the data view itself, but what I want to achieve is to restrict the amount of data actually being returned by the data query in the background. To this end, we’re going to change the select command used by the DVWP to only return data for the current month.

Switch to the code view in SPD and find the top of the DVWP declaration in code. It should look something like this:-

We’re going to replace this with our own bit of CAML query language to return just the data that we want.

(Note: When I originally designed this solution, I came up with the calculated columns idea that results in the query below. When I delved further into CAML date filtering, it was suggested that I look at using a construction instead but I found that items for the last day of previous months were sometimes creeping in.)

So, using the StartofMonth and EndofMonth columns, we have a query that looks like this:-

<Query>
   <Where>
      <And>
         <Leq>
            <FieldRef Name='StartofMonth' />
            <Value Type='DateTime'><Today/></Value>
         </Leq>
         <Geq>
            <FieldRef Name='EndofMonth' />
            <Value Type='DateTime'><Today/></Value>
         </Geq>
      </And>
   </Where>
</Query>

And returns only those entries that exist within the month we’re currently in (That’s using the entry. You could specify a date if you wanted results for that particular month.)

So, paste that query into the select command, save the file (don’t worry about the ghosting message, we’ll sort that out later if performance is a concern for you.), and you should now see a view similar to the following. (notice that I haven’t bothered encoding the <> as SPD will do that for you when the file is saved.

Query in Code & Results in Design View

Query in Code & Results in Design View

So if we now browse to our web/monthlyperformance.aspx page, you should see a nice data form with 4 items for the current month visible. If you can see any items that shouldn’t be there, then you may need to test your query is working using U2U’s CAML builder.

At this point we now have the data that we want to represent in Bar chart format, but represented in list form. This is the point where it starts looking like code as we delve into the wonders of XSL to transform the raw list data into a nicely styled view for our director.

To make this easier to manage, we’ll use an external XSL file to transform the data and point the DVWP at it. Here’s the XSLT that we’re going to use. Cut and paste it into notepad, save it as something useful like ‘SalesGraphsByAccountManagerForMonth.xsl” and then drag and drop it into the root of your site in SPD.

The xsl file is commented heavily so should explain whats happening to enough of a degree that you can change this to sort your own ends.

SalesGraphsByAccountManagerForMonth

Once the xsl file has been edited to meet your needs (More importantly to match the Account Manager names etc in your data), the DVWP can be pointed at it.

Open the MonthlyPerformance.aspx page in your browser and select edit page. Select modify shared webpart on the drop down option on the DVWP and then click on Miscellaneous.

Click on XSL link and enter the URL of the XSL file that you dropped into the root of your web.

Click on OK and your page should magically transform into the view below.. (Note: I over achieved against my targets as you can see, having achieved 915% of my target. The bar chart however stops at 100%! This is quite deliberate!)

Results if all went well

Results if all went well

Troubleshooting

If you see the bars but no values, then your field names are most likely the culprits. Make double sure that you are using the internal name as SharePoint knows your fields. To double check this, browse to the list settings for your chosen list, Click on the column name and check the URL in IE. You should see a querystring in the form &Field=Sales_x0020_Type or similar. This is your internal name.

Ghosted/Unghosted Pages

If you’re worried about having an unghosted page in your web, simply export the webpart that you’ve created. Delete the page and re-create it, then import the webpart once more.

Hopefully this little guide has helped you out.

Regards

Paul.

Thu 18 Oct 07

MCTS: Moss 2007 Configuration & Administration

Filed under: SharePoint, Training — Reginald @ 12:13 pm

I suddenly realised the other day that I had a Prometric voucher that was due to expire. So, I decided to bite the bullet and take 70-630, The MCTS exam for configuration MOSS 2007.

This exam goes in much greater depth than the WSS version, with a heavy focus on Forms, Excel, Business Data Catalogue and Search services. There’s nothing really about the bear bones of SharePoint as this is covered in much more depth in the WSS V3 exam.

I would heartily recommend doing the WSS V3 one first (70-631 i think), and then studying up on the areas mentioned above and having a crack at 70-630.

I pleased myself with a score of 875! Needless to say I’m a little chuffed today!

Sat 24 Feb 07

Home again.

Filed under: Training — Reginald @ 2:50 pm

Well the journey home wasn’t too bad, although I had to dive off the M1 at junction 10 due to the traffic backing up from the M25. Apparently 44 miles of queuing traffic trying to get round from Leatherhead to the M1 was to blame! I cut along the A1081 and through St Albans which wasn’t too bad. (Apart from the dodgy diversion around St Albans town centre whilst they pedestrianise it.)

Anyhow, I promised a review of the course, so here goes:-

SharePoint 2007 Administration Track – Combined Knowledge Training
5 Days – Best Western Hotel – Ullesthorpe

Instructor Craig Carpenter

Overview:-

The course covers 5 days and runs from 9:30 each morning to approc 5pm each night. It starts with an initial introduction to MOSS 2007 and how the course will cover it as well as the obligatory, who are you and what is your background. The course notes are well written however there are some inaccuracies that still need to be ironed out. This is due to the course notes being originally written at Beta TR2 stage. The course covers all of the ‘Core’ functionality and as such does not go into any great detail regarding the Enterprise options. Therefore don’t expect to cover Excel Services, Business Data Catalogue or KPI’s other than to mention where the options exist.

The instructor Craig had a very good presenting style and chose not to plough page by page through the book as some courses do. As he said ‘If we do that, you may as well read the book yourself’. Instead he let himself be guided by flow of the books modules, covering each topic in turn through demonstration and discussion. (Personally I found this the most engaging method and even with the odd 2am finish the night before, I was at full attention for 98% of the day)

Overall, I found the course to be extremely useful and very well presented. There was the odd moment where I found the discussions a little below my skill level, however Craig had to cater for all levels of experience in the course. It was however a good oppourtunity to play with the test system in front of me.

The price for the course was £2000 including the accomodation. When you take into account that this includes all food and refreshments during the day and evening (Drinks have to be paid for yourself in the evenings!), as well as the course itself, then I think this more than matches up to a standard MicroSoft course which normally run at around £200 per day. The hotel itself was extremley pleasant and the rooms were of a very good standard. The food is plentiful and the staff very nice and always happy to help you with any needs. In addition, I was lucky enough to be with a very nice group of people that were happy to socialise in the evenings. This is one aspect of training courses that I normally find lacking, however this one was a nice exception. (I won one of the games of bowling too!! 157 points!)

Course Breakdown:-

Module 0 – Discussed the problems facing Corporations today and discussed the need for SharePoint and what its driving requirements were.

Module 1 – Reviewed the MOSS 2007 architecture, discussing the base requirements for an installation as well as the supporting services (e.g. .Net, IIS). Demonstrated Collaboration, Portal Services, Content Management and other features.

Module 2 – Covered installation and configuration of Single Server farms in MOSS 2007. Craig talked at length about the requirement for multiple user accounts and the need to ensure that the install account is only used for that purpose.

Module 3 – Configuring and Administering Central Administration Operations in MOSS 2007 – Introduced Central Administration, a new concept for MOSS 2007 that brought all the familiar options from 2003 into a central area as well as a whole host of unfamiliar options for the control of the Farm and related services

Module 4 – Configuring and Administering Application Management in MOSS 2007 – As with Opertions, this section looks at the Application Management abilities that are now pulled into a central location for control of the Application Pools and Shared Service Providers within one place.

Module 5 – Configuring and Administering Shared Service Providers – Details the configuration and administering of SSP’s for the provision of services such as Search, Profiles and My Sites, Excel Services, Usage reporting and the Business Data Catalogue.

Module 6 – Overview of MOSS 2007 site templates – A nice straight forward look at the template options available with MOSS 2007 as well as what abilities you have to create and modify you’re own templates. (Also a handy hint on how to get around the 10Mb limit on templates)

Module 7 – Working with SharePoint Web Parts – Covered the use of the out of the box templates, installing third party web parts, exporting and inter connection of web parts in the site.

Module 8 – Design Considerations and Scaling out a Farm. This topic covered some of the planning decisions you should consider when installing your MOSS 2007 infrastructure, as well as the Pros and Cons of the various initial configurations. Covered a brief introductions to NLB and other load balancing options for Multiple Web Front Ends, as well as the idea of distributed service models.

Module 9 – Portal Overview and Administration – This topic looked at what the role of a portal was and how best to administer this in a corporate environment. Looked at the use of My Sites and audiences to deliver the correct content to the correct recipient.

Module 10 – Covered in some detail the configuration of search and indexing within the MOSS 2007 environment. Some very good exercises on the configuration of the crawl rules and scope.

Module 11 – Configure and Administer Document Management in MOSS 2007 – Covered the use of content types within libraries and the use of workflows to control them. (Note, only out of the box workflows are covered and not those created within SharePoint designer)

Module 12 – Configure and Administer Records Management in MOSS 2007 – This covered the configuration of Microsofts first entry into the records management arena. Coveres retension periods, auditing and disposition at expiry,

Module 13 – Overview of Web Content Management in MOSS 2007 – Covers the use of the publishing feature throughout MOSS 2007 and the methods available to affect the branding of the SharePoint site through master pages. Includes the use of re-usable content and the publish to another location options. This section also includes the idea of Variation pages that are tied to such things as Language or browser type and can be used to deliver targetted content.

Module 14 – Disaster Recovery in MOSS 2007 – This about says it all, however it does cover some of the very different backup options available to you in MOSS 2007 as well as some of the more familiar terms that you will have seen in SP 2003.

Powered by WordPress