So not too long ago, a client of mine decided that they wanted some nice charts on their WSS based intranet. You see the problem straight away.. No Moss, so no access to the KPI webparts, so it was time to drop to the old faithful, the Data View Web part to solve this problem…
Scenario:- The Sales Director wants to have a screen in SharePoint where he can monitor all Sales Managers performance against target for the current month.
Use case:-
• Data should be displayed as a single bar for each sales manager.
• Data should also be broken down against the targets for Consultancy and Managed services.
• Sales Data will be entered as Sales order numbers are generated on receipt of a firm order.
• Sales target will be 1/12 of the yearly target. No adjustment will be made for time of year.
• Bar colour should change depending on % of target achieved. <50,50-99,100 will be the bands used.
First we create a custom list called Sales that will be used to track every sale, this is created with the following fields.
Title ———– String – Sale comment
Value ———– Currency – Value of the sale
Account Manager – Lookup – A lookup to the list of Sales Managers
Sales Type —— Lookup – A lookup to the list of Sales Types
Client ———- BDC Lookup to SalesForce (Use a string for now as it makes no difference to this example)
Date of Sale —- DateTime (Date only)
StartofMonth —- Calculated (DateTime-Date only) – This field is calculated using the following formulae to give the first day of the month this order was dated in. (See below for an explanation of why we use a calculated column)=DATE(YEAR([Date of Sale]),MONTH([Date of Sale]),1)
EndofMonth —— Calculated (DateTime-Date only)– This field is calculated using the following formulae to give the first day of the month this order was dated in. (See below for an explanation of why we use a calculated column)
=DATE(YEAR([Date of Sale]),MONTH([Date of Sale])+1,1)-1
Be careful with the creation of the column Date Of Sale as this will be used in a CAML query later on. I didn’t create this column and therefore the spaces get encoded in the CAML string (Date_x0020_of_x0020_Sale).
Best practice when creating columns is to create them with a concatenated name first, then edit and expand the name later. E.g. DateOfSale is created, then renamed Date Of Sale. The internal name remains DateOfSale, rather than Date_x0020_of_x0020_Sale!
The following data has been populated for testing (Note: I’m using this test in September, so adjust the date of sale to match the calendar month that you’re testing in.)
Once you’ve got that small amount of data, we’ll also need to upload the three colour images used by the CSS in the creation of the colour coded bars for the chart.
These small files can be taken from here using right click and save as. (Don’t worry about the size as they are actually only 1 pixel wide.)
Red Yellow and Green bars for the chart.
Once you’ve downloaded these images, save them into the /12/TEMPLATES/IMAGES/ directory on your server (All WFE’s if installing this in a farm.)
The next step is to fire up SharePoint Designer and open up your website (Sandbox environment please if this is the first time!). In order to keep the look and feel nice and similar, I decided to copy the default.aspx in the root of the site, and repasted it as monthlyreports.aspx (all in SPD). Open this page in the browser and delete (not close) any webparts that are on the page. This should leave us with a nice clean page with the left nav and top chrome all visible.
Back to SPD and it’s time to add the DataViewWebPart. Click on the ‘left’ webpart zone in the design canvas to select it, then click on Insert/SharePoint Controls/DataView to place a new data view on the page.
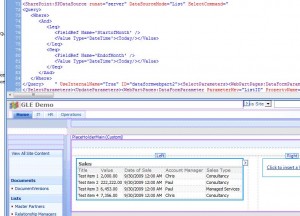
SPD should look something like this now:-
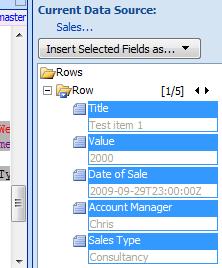
Now we have the DVWP inserted, you should now see the Data Source pane on the right hand side. Look in the library for the list we created earlier. Right click on it and choose show data. this will display the list of available fields. For our Query we’re going to need the first five columns, Title, Value, Date of Sale, Account Manager and Sales Type.
Once these are highlighted, click ‘Insert selected fields as – Multiple Item View.’
Once done, you should see our test data displayed in tabular form in the design view. The only problem here is that it’s all of our data, unfiltered and unsorted. At this point, you could use a filter in the data view itself, but what I want to achieve is to restrict the amount of data actually being returned by the data query in the background. To this end, we’re going to change the select command used by the DVWP to only return data for the current month.
Switch to the code view in SPD and find the top of the DVWP declaration in code. It should look something like this:-
We’re going to replace this with our own bit of CAML query language to return just the data that we want.
(Note: When I originally designed this solution, I came up with the calculated columns idea that results in the query below. When I delved further into CAML date filtering, it was suggested that I look at using a
So, using the StartofMonth and EndofMonth columns, we have a query that looks like this:-
And returns only those entries that exist within the month we’re currently in (That’s using the
So, paste that query into the select command, save the file (don’t worry about the ghosting message, we’ll sort that out later if performance is a concern for you.), and you should now see a view similar to the following. (notice that I haven’t bothered encoding the <> as SPD will do that for you when the file is saved.
So if we now browse to our web/monthlyperformance.aspx page, you should see a nice data form with 4 items for the current month visible. If you can see any items that shouldn’t be there, then you may need to test your query is working using U2U’s CAML builder.
At this point we now have the data that we want to represent in Bar chart format, but represented in list form. This is the point where it starts looking like code as we delve into the wonders of XSL to transform the raw list data into a nicely styled view for our director.
To make this easier to manage, we’ll use an external XSL file to transform the data and point the DVWP at it. Here’s the XSLT that we’re going to use. Cut and paste it into notepad, save it as something useful like ‘SalesGraphsByAccountManagerForMonth.xsl†and then drag and drop it into the root of your site in SPD.
The xsl file is commented heavily so should explain whats happening to enough of a degree that you can change this to sort your own ends.
SalesGraphsByAccountManagerForMonth
Once the xsl file has been edited to meet your needs (More importantly to match the Account Manager names etc in your data), the DVWP can be pointed at it.
Open the MonthlyPerformance.aspx page in your browser and select edit page. Select modify shared webpart on the drop down option on the DVWP and then click on Miscellaneous.
Click on XSL link and enter the URL of the XSL file that you dropped into the root of your web.
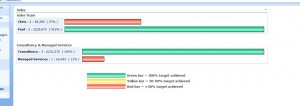
Click on OK and your page should magically transform into the view below.. (Note: I over achieved against my targets as you can see, having achieved 915% of my target. The bar chart however stops at 100%! This is quite deliberate!)
Troubleshooting
If you see the bars but no values, then your field names are most likely the culprits. Make double sure that you are using the internal name as SharePoint knows your fields. To double check this, browse to the list settings for your chosen list, Click on the column name and check the URL in IE. You should see a querystring in the form &Field=Sales_x0020_Type or similar. This is your internal name.
Ghosted/Unghosted Pages
If you’re worried about having an unghosted page in your web, simply export the webpart that you’ve created. Delete the page and re-create it, then import the webpart once more.
Hopefully this little guide has helped you out.
Regards
Paul.


1 comment
1 ping
Author
Note: This is an extension to the original published on the Microsoft site which I’ve adapted to suit the client requirements to work out an actual target against total sales, Introducing some XSL math to the mix. Original post here.
Also, you’ll need to right click the XSL file and choose save as, remembering to rename it to XSL as for some reason IE forces it to become XML.
[…] This post was mentioned on Twitter by Paul Hunt. Paul Hunt said: Finally got my target based DataViewWebPart bar charts written up into a #SharePoint blog post. Comments welcome. http://bit.ly/1TBtHU […]