Blog of an overweight SharePoint addict

Tue 27 Oct 09

And, that’s a rap!

Filed under: General, Programming, SPC09, SharePoint, SharePoint 2010 — Reginald @ 7:02 pm

Well the MS SharePoint 2009 conference is over and life is slowly returning to normal. A couple of days away from SharePoint to restore my equilibrium and I’m now back to SharePoint 2007 and the real world.

But what of SharePoint 2010? When can we see it in all it’s glory. Well Steve Ballmer announced that the Beta 2 release would be sometime in November as they were doing last minute testing internally in Microsoft. During the conference, all of the SharePoint web pages were switched over to the new version and reports coming out suggest no major problems. So fingers crossed for an early Beta 2 in November.

The conference for me was all about soaking up the changes to development in SP2010. I didn’t really focus on any of the admin sessions at all as I’m planning to download and watch them on my long journeys to work over the next few weeks. So what does SP2010 bring to us Devs?

Well the big story is the much improved integration with Visual Studio 2010. (Beta 2 available now) which ships with an absolute ton of SharePoint 2010 project templates from Web Parts to Event Receivers, List Definitions, Content Types etc.

And the biggest win for me.. ONE TOUCH DEPLOYMENT!! Yes.. hit F5 and your project deploys to your test server with nary a hiccup and just a minor bit of configuration during the project set-up. Gone are the days of configuring your DDF files and your WSPs (Well once we convince all of our clients to switch to 2010 that is!!)

So my top 5 improvements (i reserve the right to get more excited about others as time unfolds):-

  1. One touch deployment for testing
  2. Automatic creation of the WSP (This should encourage more solution deployments)
  3. Visual Webpart designers (Think using a User Control without needing Son of Smart Part)
  4. Content Types that can be deployed and updated
  5. Vastly improved Tableless design

Over the next few weeks I’ll be playing with Beta 1 with Visual Studio 2010 Beta 2 (If they play nicely together) and hopefully will be rearranging this list and probably expanding it. Beta 1 is still under NDA, so nothing that hasn’t been mentioned at SPC09 will be raised, but hopefully Beta 2 won’t be far around the corner.

Paul.

Tue 13 Oct 09

Tentative Schedule for SharePoint Conference 2009 – Las Vegas

Filed under: General, SPC09, SUGUK, SharePoint, SharePoint 2010 — Reginald @ 2:53 pm
Join me at SPC09

Twitter @Cimares

Ok, so Microsoft finally released the full session schedule during the last 24 hours and I’ve tentatively booked the sessions that I want to go see.. And this has to be subject to change because there are so many great sessions that i want to get into. Thank god Microsoft are going to provide an AV feed of all sessions within 48 hours of them finishing. Hopefully I can download these and watch them on the train into work during the following week.

So, here’s my current schedule..(Subject to Change.. Hastags for Twitter Search)

Saturday 17th

  • Arriving about 2:30pm PST
  • Gambling and trying to avoid jetlag! Probably joining @jthake somwhere in Vegas

Sunday 18th

  • Getting to see Vegas,
  • Catch the Formula 1 somewhere (#ShareF1)
  • 18:00 ish.. register then #SharePint

Monday 19th

  • 9:00AM – Keynote Speech – Steve Ballmer
  • 10:30AM – Keynote 2 – Jeff Teper
  • 1:15PM – Overview of the SP2010 Developer platform
  • 2:45PM – Visual Studio 2010 SP Development Tools Overview
  • 4:30PM – Developing with SP2010 Sandboxed Solutions
  • Evening – no idea yet..going with the flow.

Tuesday 20th

  • 9:00AM – Advanced Webpart development in VS2010
  • 10:30AM SP2010 based document assembley and manipulation using Word
  • 1:15PM – Authentication & Authorisation in SP2010
  • 1:15PM – Deep Dive Open XML and Open XML SDK
  • 2:45PM – SP2010 Upgrade part 1 – Fundamentals
  • 4:30PM – SP2010 Development Best practices
  • Evening – 80’s Beach party!!!!! and then #TweetupSPC09 if it’s still going on

Wednesday 21st

  • 9:00AM – Workflow development in SP2010 with VS2010
  • 10:30AM – Developing with the new User Interface features in SP2010
  • 1:15PM – Developing with REST and LINQ in SP2010
  • 2:45PM – Extending the VS2010 SP tools with new Designers
  • 4:30PM – Customizing the VS2010 Sharepoint deployment process
  • Evening – Jury’s out on this one.. might go watch #ShareHoldem

Thursday 22nd

  • 9:00AM – Load testing SP2010 with VSTS
  • 10:30AM – Deep Dive into SP2010 Profile Store and profile Data
  • 1:15PM – Application Lifecycle Management for Developers in SP2010
  • 2:45PM – Building rich dynamic websites with SP2010
  • Evening – #ShareHofBrau – Last chance to catchup with SP stragglers..

Friday 23rd

  • 16:40 Takeoff for London Gatwick!! (arrives 10:30AM!)

So all told a pretty rammed week.. But I’m REALLY looking forward to it..

Tue 6 Oct 09

Whats the record for the longest Calculated SharePoint column?

Filed under: Calculated Fields, General, SharePoint — Reginald @ 3:28 pm

Well my longest to date is 304 characters.. I’m not quite sure what the SharePoint limit is, but here’s mine…

=IF(LEN(MONTH(Dated)/3)=1,TEXT(Dated,”mmm-yy”),IF(LEN((MONTH(DATE(YEAR(Dated),MONTH(Dated)+1,DAY(Dated))))/3)=1,TEXT(DATE(YEAR(Dated),MONTH(Dated)+1,DAY(Dated)),”mmm-yy”),IF(LEN((MONTH(DATE(YEAR(Dated),MONTH(Dated)+2,DAY(Dated))))/3)=1,TEXT(DATE(YEAR(Dated),MONTH(Dated)+2,DAY(Dated)),”mmm-yy”),”ERR”)))

“And what pray, does that monstrosity do”, I hear you ask…

The answer is, it simply works out which quarter of the companies financial year the item appears in. The list item has a column called Dated which is a date only field.

Our financial year runs 1st Oct to 30th Sept with each quarter ending Dec,Mar,Jun,Sep.

In order to work out which quarter the item is in, I’ve nested 3 IF’s together.. If you’re not familiar with how the =IF function works in a calculated column, then it breaks down like this..

=IF(jonnysapples > janesapples,”Jonny has more apples”,”Jane has more apples”)
=IF(SOMETHING TO TEST) , DO THIS FOR TRUE , DO THIS FOR FALSE)

So in this instance if the column named Jonnysapples does indeed have more apples in it, then the phrase “Jonny has more apples” will be displayed in the resulting column. If it doesn’t, then “Jane has more apples” will be displayed.

Excellent.. So now what we want to do, is replace the output statement for FALSE (”Jane has more apples“) with the next test to see if Jonny is unhappy.

e.g.

=IF(jonnysapples > janesapples,”Jonny has more apples”,IF(jonnysmoney>0,”Jonny doesn’t care as he can buy some more”,”Jonny is upset because Jane has more apples”))

So, working the logic through,if Jonny has more Apples, we’ll see “Jonny has more apples“, if he has less, but some money (After checking the money column), then we’ll see “Jonny doesn’t care as he can buy some more” and then finally, if Jonny has less apples and no money, We’ll see the final state of “Jonny is upset because Jane has more apples

So now we’ve implemented a 3 state result. By nesting a further if statement we’re able to twist this solution to our means.

So now we need to look at what logic we’re actually implementing in each of the IF statements.If you extract the “Something to test” part out of the first statement you’ll see:-

LEN(MONTH(Dated)/3)=1

Now if you bear in mind that the months that represent our year quarter period ends are all a factor of 3, then it starts to make sense. (Sept – 9th Month, June, 6th Month etc) Take the numeric value for the month. if you divide it by 3 and get a whole number e.g. a result with a length of 1, then we’re in a month divisible by 3. if we get any form of decimal, then we’re not.

=IF(LEN(MONTH(Dated)/3)=1,TEXT(Dated,”mmm-yy”),”DO THIS FOR FALSE”)

So if the month can be divided by 3 without any decimals, we’ll output the Dated column, formatted to look like mmm-yy. If it can’t then we’ll step into the next if statement in place of “DO THIS FOR FALSE”.

Again, very similar logic, however this time, we’re going to add 1 month to the date in Created and test that..

IF(LEN((MONTH(DATE(YEAR(Dated),MONTH(Dated)+1,DAY(Dated))))/3)=1,

If that results in a whole number, then we’ll output the Created+1 month using TEXT(DATE(YEAR(Dated),MONTH(Dated)+1,DAY(Dated)),”mmm-yy”),

And if it doesn’t? Yep you guessed it, we step into the third and final IF statement which we know is going to be true because the 4 month will divide by 3 once again. However to keep the parser happy, we’ve got to have an option of something to output for False, so that’s where you’ll see “ERR” in the formulae.

If this has worked, all you’ll see in your calculated column is Sep-09,Dec-09,Mar-10,Jun-10 etc….

This solution might not work for your if you use a different financial year and quarters, but the principal is sound..

Regards

Paul.

Mon 5 Oct 09

Weekly Access problems to a SharePoint site

Filed under: General, IIS, Troubleshooting — Reginald @ 9:11 pm

Just recently a client of mine raised an issue regarding an access issue that seemed to raise it’s head about every 8 days or so. What struck me was the distinct lack of errors issues by the system.

Approximately every 8 days, users will go to use the site and get a failed to connect to site error. IISReset and AppPool recycles don’t resolve the problem, and only a reboot of the Web Front End resolves the issue.

IIS Logs just show connections stopping at a fixed time and the SharePoint logs show nothing other than the usual trace log messages around timer jobs and index crawls.

It wasn’t until I examined the HTTPERR log file (Located normally in C:\windows\system32\logfiles\HTTPERR) that I realised what was likely to be happening as it was showing Connection Refused.

2009-10-02 10:59:07 – - – - – - – - – 2_Connections_Refused -
2009-10-02 10:59:13 – - – - – - – - – 1_Connections_Refused -
2009-10-02 10:59:17 – - – - – - – - – 2_Connections_Refused -

Basically, all incoming connections to a web server are handled by the HTTP.SYS portion of the system before being handed out first to IIS and then to the respective handler for applications such as SharePoint. Hence the distinct lack of error logs in IIS and SharePoint.

This system process utilizes Non Paged Pool memory extensively, however it has a little known security feature that starts to refuse connections once there is only 20Mb remaining in the NPP.

At this point it’s important to remember that HTTP.SYS is not the cause of your problem, merely a symptom of a system with potentially a few things wrong with it. So how do we trouble shoot this little problem on a SharePoint WFE.

So the first place to check is how much NPP memory you have available to you. A Windows 2003 32 Bit server should have 256Mb of NPP available at boot. However if for some reason you have the /3GB switch specified in your boot.ini, this NPP allocation is halved to 128Mb. In addition, the /3Gb option is NOT SUPPORTED for SharePoint and must be removed. (KB933560)

So at this point we’ve doubled the NPP available to us, but this may not have solved the problem as something else is in process taking that memory and possibly leaking it away by not returning it properly to the pool. In these instances you need an application called PoolMon.exe from the Windows Server 2003 resource kit.

Using this tool it is possible to identify the driver or system file that is not returning memory properly to the NPP, which in my case was down to an old Broadcom Ethernet driver for the Dell PowerEdge server this system was running on.

I won’t re-create the posts on how to use the Poolmon tool as there are some good ones out there, but the MS articles that show you how to use the PoolMon.exe program are below.

KB177415 – How to use Memory Pool Monitor to troubleshoot Kernal mode memory leaks.

On a side note, if you have Windows 2003 SP2, then you may need to think about disabling the TCP Chimney as per KB945977

Hope this helps you some way to resolving a similar issue.

Paul.

Thu 1 Oct 09

Creating a Sales Dashboard using the DataViewWebpart & XSL

Filed under: SharePoint, Training, XML — Reginald @ 7:51 pm

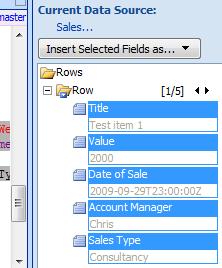
So not too long ago, a client of mine decided that they wanted some nice charts on their WSS based intranet. You see the problem straight away.. No Moss, so no access to the KPI webparts, so it was time to drop to the old faithful, the Data View Web part to solve this problem…


Scenario:- The Sales Director wants to have a screen in SharePoint where he can monitor all Sales Managers performance against target for the current month.

Use case:-
• Data should be displayed as a single bar for each sales manager.
• Data should also be broken down against the targets for Consultancy and Managed services.
• Sales Data will be entered as Sales order numbers are generated on receipt of a firm order.
• Sales target will be 1/12 of the yearly target. No adjustment will be made for time of year.
• Bar colour should change depending on % of target achieved. <50,50-99,100 will be the bands used.

First we create a custom list called Sales that will be used to track every sale, this is created with the following fields.

Title ———– String – Sale comment
Value ———– Currency – Value of the sale
Account Manager – Lookup – A lookup to the list of Sales Managers
Sales Type —— Lookup – A lookup to the list of Sales Types
Client ———- BDC Lookup to SalesForce (Use a string for now as it makes no difference to this example)
Date of Sale —- DateTime (Date only)
StartofMonth —- Calculated (DateTime-Date only) – This field is calculated using the following formulae to give the first day of the month this order was dated in. (See below for an explanation of why we use a calculated column)

=DATE(YEAR([Date of Sale]),MONTH([Date of Sale]),1)

EndofMonth —— Calculated (DateTime-Date only)– This field is calculated using the following formulae to give the first day of the month this order was dated in. (See below for an explanation of why we use a calculated column)

=DATE(YEAR([Date of Sale]),MONTH([Date of Sale])+1,1)-1

Be careful with the creation of the column Date Of Sale as this will be used in a CAML query later on. I didn’t create this column and therefore the spaces get encoded in the CAML string (Date_x0020_of_x0020_Sale).

Best practice when creating columns is to create them with a concatenated name first, then edit and expand the name later. E.g. DateOfSale is created, then renamed Date Of Sale. The internal name remains DateOfSale, rather than Date_x0020_of_x0020_Sale!

The following data has been populated for testing (Note: I’m using this test in September, so adjust the date of sale to match the calendar month that you’re testing in.)

The test data for our chart.

The test data for our chart.

Once you’ve got that small amount of data, we’ll also need to upload the three colour images used by the CSS in the creation of the colour coded bars for the chart.

These small files can be taken from here using right click and save as. (Don’t worry about the size as they are actually only 1 pixel wide.)

RedBarYellowBarGreenBar

Red Yellow and Green bars for the chart.

Once you’ve downloaded these images, save them into the /12/TEMPLATES/IMAGES/ directory on your server (All WFE’s if installing this in a farm.)

The next step is to fire up SharePoint Designer and open up your website (Sandbox environment please if this is the first time!). In order to keep the look and feel nice and similar, I decided to copy the default.aspx in the root of the site, and repasted it as monthlyreports.aspx (all in SPD). Open this page in the browser and delete (not close) any webparts that are on the page. This should leave us with a nice clean page with the left nav and top chrome all visible.

Back to SPD and it’s time to add the DataViewWebPart. Click on the ‘left’ webpart zone in the design canvas to select it, then click on Insert/SharePoint Controls/DataView to place a new data view on the page.

SPD should look something like this now:-

DataViewWebPart

DataViewWebPart

Now we have the DVWP inserted, you should now see the Data Source pane on the right hand side. Look in the library for the list we created earlier. Right click on it and choose show data. this will display the list of available fields. For our Query we’re going to need the first five columns, Title, Value, Date of Sale, Account Manager and Sales Type.

Fields

Fields

Once these are highlighted, click ‘Insert selected fields as – Multiple Item View.’

Once done, you should see our test data displayed in tabular form in the design view. The only problem here is that it’s all of our data, unfiltered and unsorted. At this point, you could use a filter in the data view itself, but what I want to achieve is to restrict the amount of data actually being returned by the data query in the background. To this end, we’re going to change the select command used by the DVWP to only return data for the current month.

Switch to the code view in SPD and find the top of the DVWP declaration in code. It should look something like this:-

We’re going to replace this with our own bit of CAML query language to return just the data that we want.

(Note: When I originally designed this solution, I came up with the calculated columns idea that results in the query below. When I delved further into CAML date filtering, it was suggested that I look at using a construction instead but I found that items for the last day of previous months were sometimes creeping in.)

So, using the StartofMonth and EndofMonth columns, we have a query that looks like this:-

<Query>
   <Where>
      <And>
         <Leq>
            <FieldRef Name='StartofMonth' />
            <Value Type='DateTime'><Today/></Value>
         </Leq>
         <Geq>
            <FieldRef Name='EndofMonth' />
            <Value Type='DateTime'><Today/></Value>
         </Geq>
      </And>
   </Where>
</Query>

And returns only those entries that exist within the month we’re currently in (That’s using the entry. You could specify a date if you wanted results for that particular month.)

So, paste that query into the select command, save the file (don’t worry about the ghosting message, we’ll sort that out later if performance is a concern for you.), and you should now see a view similar to the following. (notice that I haven’t bothered encoding the <> as SPD will do that for you when the file is saved.

Query in Code & Results in Design View

Query in Code & Results in Design View

So if we now browse to our web/monthlyperformance.aspx page, you should see a nice data form with 4 items for the current month visible. If you can see any items that shouldn’t be there, then you may need to test your query is working using U2U’s CAML builder.

At this point we now have the data that we want to represent in Bar chart format, but represented in list form. This is the point where it starts looking like code as we delve into the wonders of XSL to transform the raw list data into a nicely styled view for our director.

To make this easier to manage, we’ll use an external XSL file to transform the data and point the DVWP at it. Here’s the XSLT that we’re going to use. Cut and paste it into notepad, save it as something useful like ‘SalesGraphsByAccountManagerForMonth.xsl” and then drag and drop it into the root of your site in SPD.

The xsl file is commented heavily so should explain whats happening to enough of a degree that you can change this to sort your own ends.

SalesGraphsByAccountManagerForMonth

Once the xsl file has been edited to meet your needs (More importantly to match the Account Manager names etc in your data), the DVWP can be pointed at it.

Open the MonthlyPerformance.aspx page in your browser and select edit page. Select modify shared webpart on the drop down option on the DVWP and then click on Miscellaneous.

Click on XSL link and enter the URL of the XSL file that you dropped into the root of your web.

Click on OK and your page should magically transform into the view below.. (Note: I over achieved against my targets as you can see, having achieved 915% of my target. The bar chart however stops at 100%! This is quite deliberate!)

Results if all went well

Results if all went well

Troubleshooting

If you see the bars but no values, then your field names are most likely the culprits. Make double sure that you are using the internal name as SharePoint knows your fields. To double check this, browse to the list settings for your chosen list, Click on the column name and check the URL in IE. You should see a querystring in the form &Field=Sales_x0020_Type or similar. This is your internal name.

Ghosted/Unghosted Pages

If you’re worried about having an unghosted page in your web, simply export the webpart that you’ve created. Delete the page and re-create it, then import the webpart once more.

Hopefully this little guide has helped you out.

Regards

Paul.

Powered by WordPress